It’s a familiar story in boardrooms and strategy sessions: a once-unstoppable company, the darling of its industry, sees its explosive growth begin to slow. The upward trajectory that seemed endless starts to level off, and a sense of unease creeps in. Is this the peak? Is it the beginning of the end? This moment of reckoning is not a sign of failure but a critical juncture every successful organization faces. The most resilient and innovative companies, however, possess a “strategic map” to navigate this very challenge.
There is no black and white here, as you can be in diverse maturity phases within your business lines or products. What’s more you should be, thus you can be in the Sailing phase (see Nail it, scale it, sail it) in your more established product, while you are in the inception phase of a new product (serving the same purpose as the latter) but that uses an alternative emerging technology.
This map is known as the S-Curve, a powerful model for understanding and predicting the lifecycle of technologies, products, and even entire business models. It provides a framework for diagnosing your current position, making decisive strategic moves, and, most importantly, planning for the next wave of growth before the current one subsides. This article offers a practical playbook for mastering the S-Curve, transforming it from an abstract theory into an essential tool for sustainable success. Let’s dive into the anatomy of the S-Curve to understand its fundamental principles.
The Anatomy of Innovation: What is the S-Curve?
At its core, the S-Curve is a graphical model that illustrates how a new technology, innovation, or business model progresses over time. Plotted on a graph, it shows performance or market adoption on the Y-axis against time or cumulative effort on the X-axis. The resulting “S” shape is not just a neat visualization; it represents a predictable, three-phase journey of innovation that astute leaders can learn to identify and leverage.
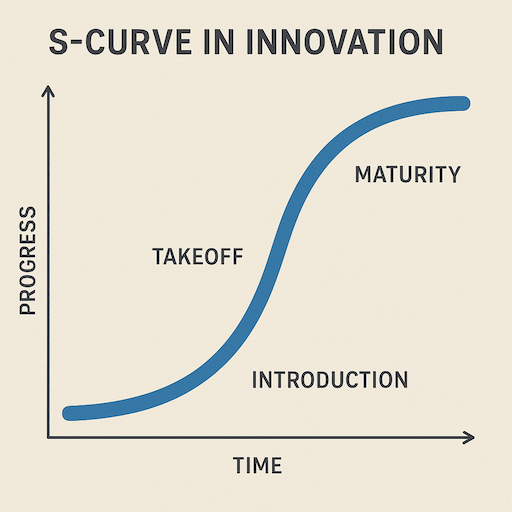 S-Curve time cycle: Y-axis (Performance/Adoption) and X-axis (Time/Effort). Source: generated with gpt4o.
The journey begins in the first phase, often called Inception or Introduction. This initial period is characterized by slow growth, high uncertainty, and significant investment in research and development. As noted in research on innovation management from Open University, performance improvement in this phase is initially slow as fundamentals are learned and key problems are solved. The focus is on capturing the attention of a small group of early adopters who are willing to experiment with a nascent product. It’s a period of intense learning, iteration, and discovery, where the goal is less about revenue and more about proving the core concept.
If the innovation survives the Inception phase, it enters Takeoff or Growth. This is the steep, exhilarating part of the curve where adoption accelerates, and growth becomes exponential. The market validates the idea, competition intensifies, and the primary challenge shifts to scaling operations to meet surging demand. As Forbes Council experts note, navigating this phase requires a keen focus on high performance and strategic alignment to capitalize on the momentum. This is where fortunes are made, and market leaders are established.
Finally, the curve begins to flatten, entering the Maturity or Plateau phase. Growth slows as the market becomes saturated. The focus shifts from rapid expansion to operational efficiency, cost optimization, and defending market share. While profitability may be at its peak, this is also a period of immense risk. As innovation scholars at The-Waves.org point out, the maturity phase often signals that the potential for further significant improvement is diminishing, making the existing business vulnerable to disruption from a new, emerging S-Curve. To make this theory more tangible, let’s explore how the S-Curve manifests in real-world business scenarios.
The S-Curve in the Wild: Real-World Examples
The S-Curve isn’t just an academic concept; it’s a dynamic force visible across every industry. Grounding the theory in concrete examples helps illuminate its practical relevance. By examining technologies we all know, we can see the distinct phases of the innovation lifecycle play out.
A classic example of an S-Curve moving from Maturity into Decline is the landline telephone. For decades, it was the undisputed king of communication, following a classic S-Curve of adoption that eventually placed a phone in nearly every home and business. However, as the technology matured and market saturation was reached, landline adoption eventually peaked before entering a steady, predictable decline as consumers “cut the cord” in favor of mobile convenience. The ascent of a new S-Curve—the mobile phone—fundamentally disrupted its reign.
A more contemporary case is the Smartphone, which currently sits firmly in the Growth to Maturity phase. Following the iPhone’s launch in 2007, the smartphone market experienced a period of explosive growth that defined the Takeoff phase. Today, while worldwide smartphone shipments still show modest growth (up 6.4% in 2024, according to IDC), the market is largely saturated. Major players like Apple, holding a 28.38% market share as of October 2024, now compete on incremental improvements—a better camera, a faster chip—rather than revolutionary new features. As technology analyst Benedict Evans aptly put it, “Smartphones are still evolving, but we’re on the upper slopes of the S-Curve.” The focus has shifted from acquiring new users to retaining existing ones and optimizing the ecosystem.
Conversely, we can see an S-Curve shifting from Inception into Growth with Public Cloud Computing. In the early days, platforms like Amazon Web Services (AWS) were met with skepticism from large enterprises hesitant to move critical infrastructure off-premises. This was the Inception phase. Today, cloud computing is in a hyper-growth Takeoff phase. According to Grand View Research, the global cloud computing market size, estimated at USD 752.44 billion in 2024, is projected to skyrocket to over USD 2.3 trillion by 2030, growing at a CAGR of 20.4%. This explosive growth is fueled by mass enterprise adoption and new demands from AI, with Goldman Sachs forecasting a 22% compound annual growth rate for the total addressable market through 2030.
Now that we’ve seen the S-Curve in action, let’s determine where your business lies on this strategic map.
Your Strategic GPS: Where Are You on the Curve?
Identifying your organization’s position on the S-Curve is one of the most powerful strategic exercises a leadership team can undertake. It provides clarity, aligns priorities, and exposes blind spots. This section serves as the diagnostic heart of our discussion, offering a framework for an honest self-assessment. Think of it as a GPS for your innovation strategy.
To pinpoint your location, consider the following questions. This checklist, inspired by foundational concepts like Everett Rogers’ “Diffusion of Innovations,” helps translate abstract feelings about your business’s momentum into a concrete diagnosis.
The S-Curve Diagnostic Checklist
- Growth Metrics: What is your year-over-year user or revenue growth rate? Is it accelerating exponentially (Takeoff), growing at a steady, linear pace (early Maturity), or decelerating (late Maturity)? Be brutally honest with the data.
- Customer Profile: Who are you selling to? Are your customers primarily innovators and risk-takers who love new technology for its own sake (Inception)? Or have you crossed the chasm into the mass market, serving the early and late majority (Growth/Maturity)?
- Product Development Focus: Where is your R&D and engineering effort concentrated? Is the team working on discovering core functionality and breakthrough features (Inception)? Is the primary challenge scaling infrastructure and systems to handle massive demand (Growth)? Or is the backlog filled with bug fixes, performance optimizations, and and minor enhancements (Maturity)?
- Market Landscape & Competition: How would you describe your market? Is it a wide-open frontier with few direct competitors (Inception)? Is it a chaotic battleground with new entrants emerging constantly and a race to consolidate (Growth)? Or is it a stable oligopoly dominated by a few large, established players (Maturity)?
- Profitability & Cash Flow: Is the business still burning cash to fund learning and development (Inception)? Is it reinvesting every dollar of profit back into aggressive growth (Takeoff)? Or is it a reliable cash cow, generating predictable profits that can be used to fund other initiatives (Maturity)?
We encourage you to use this checklist to have an honest conversation with your leadership team. Plot your answers and see where the consensus lies. This diagnosis is the essential first step. Once you’ve identified your position on the S-Curve, the next step is to understand the strategic moves that align with each phase.
The Leader’s Playbook: Strategic Moves for Each Phase
A correct diagnosis is useless without a corresponding treatment plan. Knowing where you are on the S-Curve allows you to deploy the right strategies, allocate resources effectively, and set appropriate goals. Each phase demands a different leadership mindset and a distinct operational playbook.
Playbook for Inception: The Goal is Learning
In the early days, your primary objective is not profit or scale, but learning. The game is about survival and discovery.
- Strategy: Obsess over achieving product-market fit. Talk to your early adopters constantly.
- Execution: Iterate quickly, embrace failure as a learning opportunity, and stay lean. Conserve cash, as you don’t know how long this phase will last. Your mission is to delight your first 100 users so much that they become your evangelists.
Playbook for Growth: The Goal is Scaling
Once you hit the Takeoff phase, the rules change dramatically. The market has given you a green light, and the race is on.
- Strategy: Invest aggressively. Pour fuel on the fire by scaling your sales and marketing engines. Focus on building a competitive moat—be it network effects, brand, or technology—to fend off the inevitable wave of competitors.
- Execution: Hire for scale. The team that got you here might not be the team that gets you to the next level. Maintain relentless focus on your core product and market; avoid the temptation of “shiny object syndrome.” The goal is to capture as much market share as possible while the window is open.
Playbook for Maturity: The Goal is Profitability and Funding the Future
As growth flattens, the priority shifts from expansion to optimization. This phase requires a disciplined, operational mindset.
- Strategy: Defend your market share while optimizing for profitability. Streamline processes, reduce costs, and maximize the cash flow from your core business.
- Execution: This is the most critical strategic juncture. The profits generated by your mature business must not be squandered on simply maintaining the status quo. They are the fuel for your next S-Curve. This requires reallocating capital and talent to new, experimental ventures.
Riding a single S-Curve, no matter how successful, eventually leads to stagnation. The true mark of an enduringly innovative company is its ability to master the art of jumping to the next curve.
The Art of the Leap: Jumping to the Next S-Curve
Sustainable growth is not a product of riding one S-Curve forever; it is the result of skillfully managing a portfolio of curves, leaping from a maturing one to an emerging one. This is perhaps the most difficult challenge in business, as it requires acting against human nature and organizational inertia.
The concept is best articulated by Richard Foster in his seminal book, Innovation: The Attacker’s Advantage. He describes the Timing Paradox: the best time to invest in the next S-Curve is when your current business is at or near its peak of performance and profitability. This is profoundly counterintuitive. When everything is going well, the pressure to focus on the core business is immense. It feels safer to extract every last dollar from the current success story than to divert precious resources to a risky, unproven idea. Yet, waiting until the current curve is in decline is often too late. By then, the new curve’s Takeoff phase has already begun, and an attacker likely has a significant head start.
Netflix stands as the prime case study in mastering this leap. The company didn’t just ride one S-Curve; it jumped across several. Its first curve was the DVD-by-mail business, which disrupted Blockbuster and reached a state of profitable maturity. But while the DVD business was still a thriving cash cow, Reed Hastings and his team were already investing heavily in the next S-Curve: streaming. They cannibalized their own success. Between 2013 and 2018, as the DVD business matured, their streaming subscribers nearly doubled from 33 million to 58 million (Edspira.com). Today, with over 282 million subscribers globally (Statista, Q3 2024), streaming is their mature core, and the company is now investing in its next potential S-Curves, like gaming and live events.
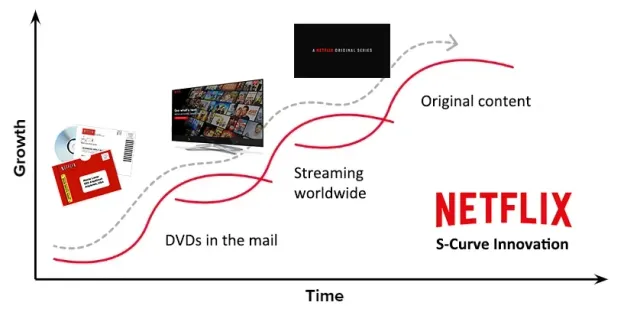 Netflix S-Curve. Source: https://medium.com/parsa-vc/jumping-s-curves-building-a-high-performance-startup-80e4410466a5
The lesson from Netflix and other enduring innovators like Apple and Amazon is that great companies operate as a portfolio of S-Curves. They have mature businesses (cash cows) that fund the growth phase of rising stars, which in turn fund the experimental bets in the Inception phase. This portfolio approach balances short-term execution with long-term viability.
Mastering the leap
The true challenge for a outlasting business is mastering the loop, through systematic innovation process able to chain product generations. Right timing is key, but the reality is that finding the equilibrium is becoming harder and harder, for many factors: velocity, competition pressure, … . An interesting reading in this regard is the book from Professor Yi (also met at IMD last year) Leap: How to Thrive in a World Where Everything Can Be Copied, which covers a wide range of cases able to surf the waves of S-Curves (in different areas, eras and industries).
Conclusion
The S-Curve is more than a retrospective model for business historians; it is a proactive framework for leaders building the future. It provides a shared language to diagnose your present and a strategic map to chart your path forward. By understanding its three distinct phases—Inception, Growth, and Maturity—you can move beyond reactive decision-making. You can anticipate challenges, align your strategy with your lifecycle stage, and allocate resources with intention.
The most profound insight, however, lies in mastering the leap. The courage to invest in the next wave of growth while the current one is still cresting is what separates enduring companies from fleeting successes. The S-Curve teaches us that innovation is not a single event but a continuous cycle of renewal. It’s a framework for building an organization that is not just resilient to change, but one that actively drives it.